Studying the Prevalence and Etiology of Class II Subdivision Malocclusion Utilizing Cone- Beam Computed Tomography
William M Anderson, Curtis M Marsh, Neil C Kessel and William J Dunn
DOI10.21767/2469-2980.100034
1Staff Orthodontist, US Naval Hospital, Naples, Italy
2Air Force Consultant in Orthodontics, Tri-Service Orthodontic Program, Air Force Postgraduate Dental School, JBSA Lackland, TX, USA
3Chief Orthodontist, AEGD-2 Residency Program, JBSA-Lackland, TX, USA
4Air Force Consultant in Dental Research, JBSA Lackland, TX, USA
- *Corresponding Author:
- William J Dunn
Professor, Uniformed Services University of the Health Sciences and Consultant to the Surgeon General for Dental Research
59 DG/SGDTG, Dunn Dental Clinic
1615 Truemper Street, Bldg 6418
JBSA Lackland, TX 78236-5551, USA
Tel: 210-671-9779
Email: William.dunn@us.af.mil
Received date: July 15, 2016; Accepted date: September 24, 2016; Published date: September 30, 2016
Citation: Anderson WM, Marsh CM, Kessel NC, et al. Studying the Prevalence and Etiology of Class II Subdivision Malocclusion Utilizing Cone-Beam Computed Tomography. J Orthod Endod. 2016, 2:4.
Abstract
Objective: The purpose of this study was to investigate the prevalence of subdivision malocclusions in Class II/1 and Class II/2 patients and to see if the II/2 group had greater skeletal asymmetry.
Materials and methods: From a sample of over 1500 records, 256 Class II malocclusions met inclusion criteria. Of these, 214 were Class II/1 and 42 were Class II/2. Seven landmarks identified on CBCT scans were used to make 8 bilateral linear measurements. Right and left side differences were calculated for each subject, and median values were compared. Linear measurements from the Class I side of the subdivision malocclusion to the Class II side were compared.
Results: 22.9% of II/1 subjects had a subdivision malocclusion versus 50% of the II/2. Significant side-to-side differences existed between II/1 and II/2 subjects in two of eight measures. There were greater differences in the II/2 group between the Class I side of subjects to the Class II side than in the II/1 group.
Conclusion: All mandibular variables indicated greater degrees of mandibular asymmetry in the II/2 group; only Co-Po proved statistically significant.
Keywords
Mandibular asymmetry; Cone-Beam Computed Tomography (CBCT); Malocclusions
Introduction
The Class II malocclusion is broadly defined as a distal relationship of the mandibular teeth relative to the maxillary teeth. Angle [1] recognized a subset of the Class II malocclusion, the Class II Division 2 (II/2) type, which exhibited a distinct triad of features. They include: Deep bite, retroclined maxillary incisors and a posteriorly positioned mandibular dental arch. Characteristics of the II/2 malocclusion are well-documented. They can be summarized as follows: skeletal components include a hypodivergent pattern, decreased lower face height, low mandibular plane angle, decreased gonial angle, and commonly, adequate mandibular body length and width in comparison to the Class II Division 1 (II/1) type. Dental components include retroclination of the maxillary central incisors, minimal overjet and deep bite [2-4].
Angle characterized the Class II/1 malocclusion as having a narrowing of the maxillary arch with protrusive incisors accompanied by abnormal function of the lips and some form of nasal obstruction and mouth breathing. The Class II/2 malocclusion is characterized by less narrowing of the maxillary arch, and lingual inclination of the maxillary incisors. A malocclusion is further classified as a subdivision when the malocclusion exists on one side of the arches but is normal on the other. The offending side determines the namesake of the subdivision [1].
Although the Angle classification system has shortcomings it remains the predominant classification system to describe the anteroposterior occlusal relationship. Most clinicians oversimplify the Class II/2 definition by focusing only on the distocclusion of the mandibular molars and canines and retroclination of the maxillary central incisors. Angle recognized a higher prevalence of subdivision malocclusion in the Class II/2 population. Angle estimated that 70% of Class II/2 malocclusions may have a subdivision component with over 50% of all Class II malocclusions having a subdivision component [1]. There is little evidence to confirm Angle’s assertions regarding the occurrence of subdivision malocclusion.
Cone-beam computed tomography (CBCT) offers distinct advantages over 2-dimensional methods for assessing asymmetry and other morphological features of the craniofacial skeleton [5]. More accurate measurements are possible with the 1:1 geometry afforded by CBCT. Berco et al. demonstrated that skull orientation does not affect the accuracy of skeletal measurements made using CBCT, eliminating positioning/orientation errors frequently seen with conventional two-dimensional imaging methods [6].
Sanders evaluated dentoalveolar and skeletal asymmetry in patients with Class II subdivision malocclusions using CBCT and found that the primary factor contributing to subdivision malocclusion is mandibular asymmetry, with a shorter and more posteriorly positioned mandible on the Class II side [7]. This was the first study examining asymmetry in Class II subdivision malocclusions utilizing CBCT, however, it failed to distinguish between Class II/1 and Class II/2 types. The purpose of this study was to investigate the hypothesis that the prevalence of subdivision malocclusions is higher in Class II/2 than in Class II/1 malocclusions and that this can be attributed to greater skeletal asymmetry in the Class II/2.
Materials and Methods
The protocol was reviewed by the Institutional Review Board (IRB) as a retrospective study of patient records and was determined to be no greater than minimal risk, involving existing data collected from information recorded in charts from August 2008 to March 2015. Individually identifying data was not recorded.
Intraoral photos, clinical examination records and CBCT scans were used to select the study sample. CBCT images were made using the iCat Platinum unit (Imaging Sciences International, Hatfield, PA) with a volume size of 170 mm (height) × 230 mm (diameter) and a 0.3 mm voxel resolution. Images were collected at 120 kVp/5 mA and recorded as digital imaging and communications in medicine (DICOM) files. Files were imported into Dolphin 3D (version 10.5, Dolphin Imaging, Chatsworth, CA).
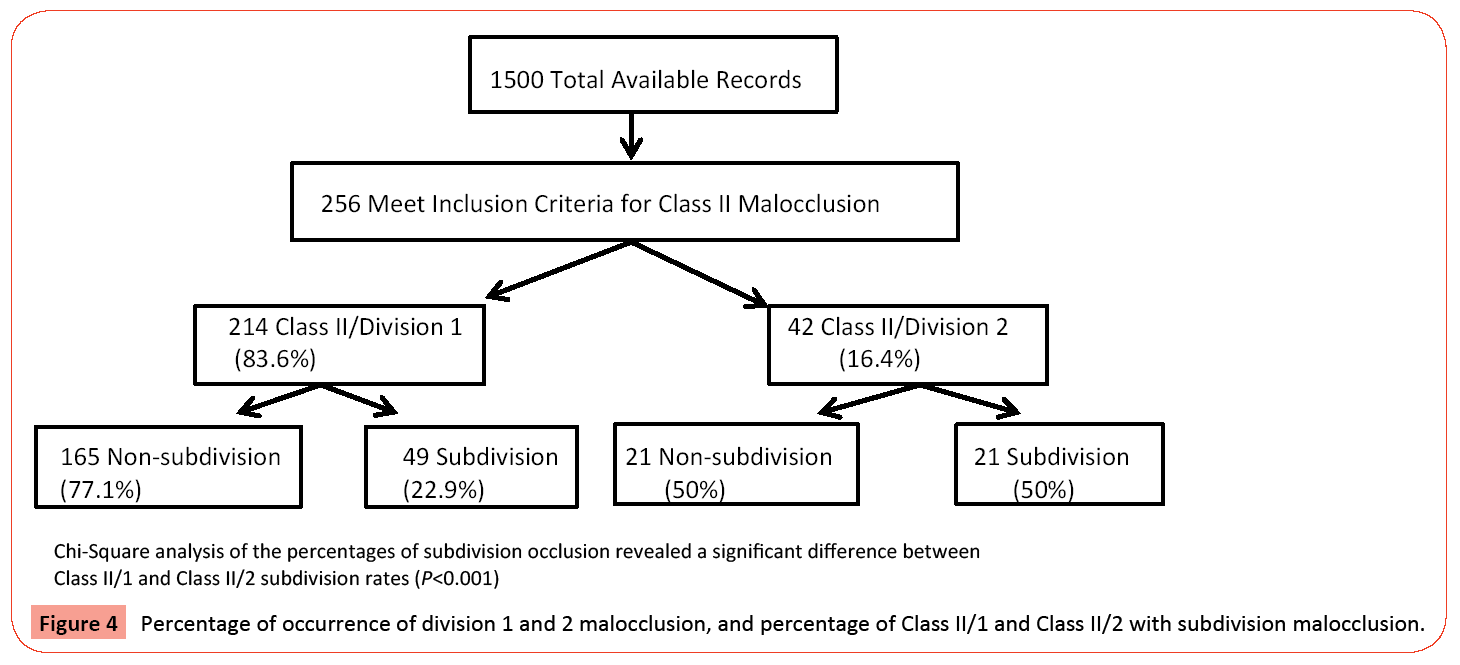
Fifteen-hundred orthodontic patient records (intraoral photos, clinical examination records, and CBCT scans) were reviewed to select the study sample. CBCT images were performed on all orthodontic patients for general diagnostic purposes. Lateral cephalometric and panoramic images were reconstructed from the CBCT scans. Patients with asymmetries and/or impacted teeth had further slices extracted. From the overall sample of 1500 records, 256 met the inclusion criteria for Class II classification: 1) At least a half-step Class II relationship on at least one side; 2) All permanent teeth erupted, including second molars; and 3) No malformed or missing teeth, or teeth with extensive restorations or decay. Two-hundred fourteen were classified as Class II/1 and 42 as Class II/2. The percentage of Division 1 and 2 malocclusions was recorded, as well as the percentage of Class II/1 and Class II/2 presenting with a subdivision malocclusion. Chi-Square analysis of the occurrences of subdivision occlusion was used to determine if there was a significant difference between Class II/1 and Class II/2 subdivision rates.
Inclusion criteria for the Class II Division 1 subdivision group included: (1) Complete Class I relationship on one side of the dental arch with at least a half-step Class II relationship on the other side; (2) All permanent teeth erupted, including second molars; (3) No malformed or missing teeth, or teeth with extensive restorations or caries; and (4) Overjet >3 mm. Inclusion criteria for the Class II Division 2 subdivision group included: (1) All of the above criteria as stated for the Class II/1 group; (2) Maxillary central incisor to Sella-Nasion line <98°; (3) Mandibular plane to Frankfurt horizontal angle <24°; (4) Overjet <3 mm; (5) Overbite >4 mm. Brezniak [8] identified pathognomonic cephalometric characteristics of Class II/Division 2 malocclusions and stated that these patients had a mean FMA of 21.4 degrees with a standard deviation of 4.6 degrees. The authors chose 24 degrees as the cutoff for this measurement.
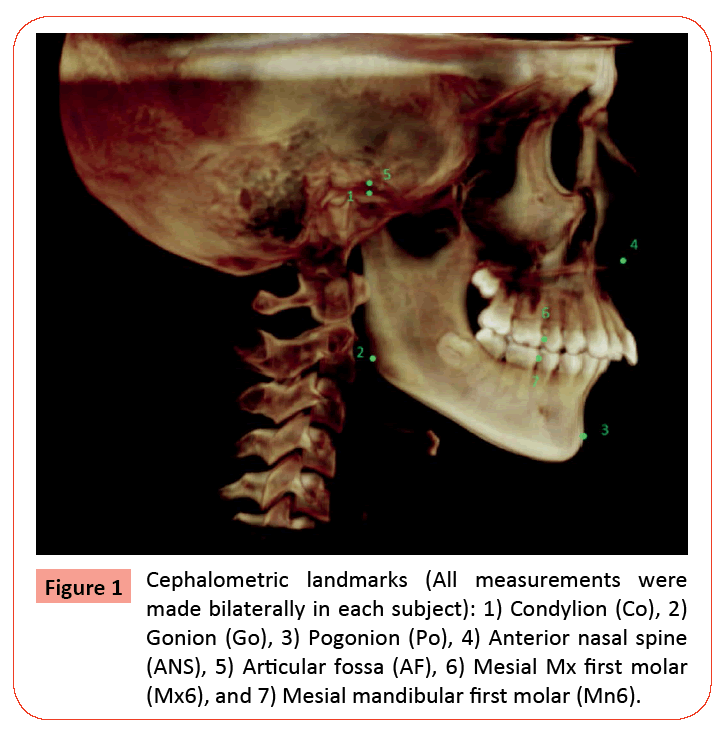
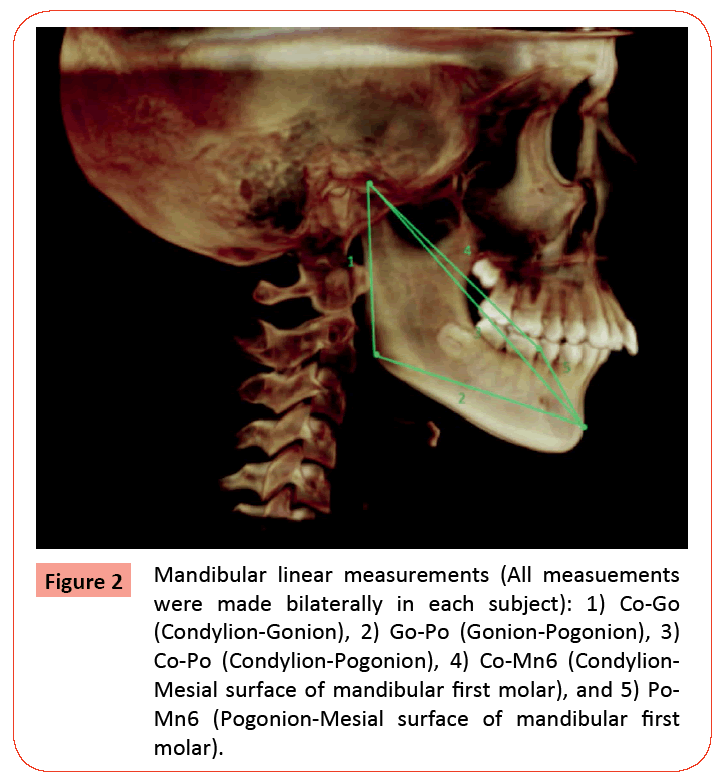
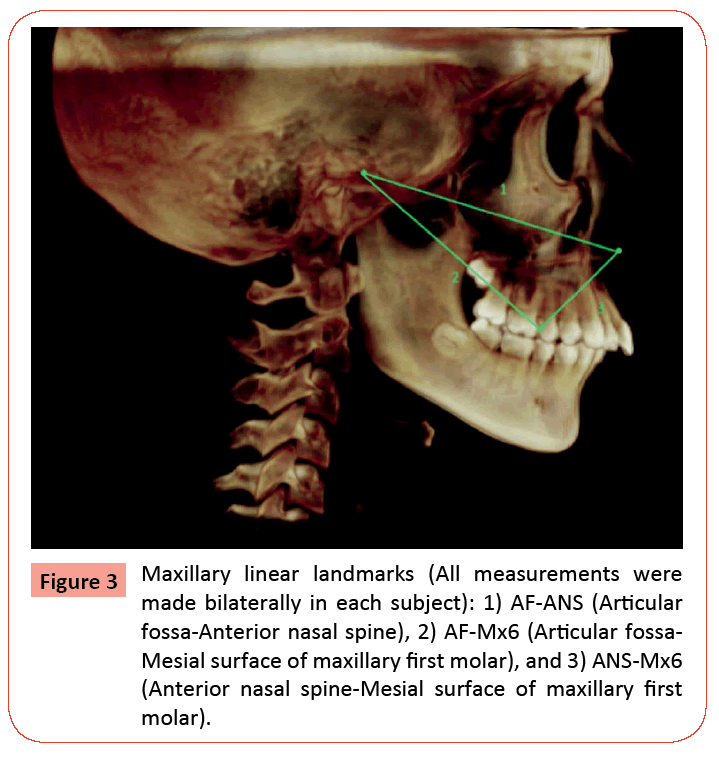
To determine the extent of asymmetry, 7 landmarks (5 bilateral landmarks and 2 midline landmarks) were chosen to make 8 bilateral linear measurements (16 total measurements/subject). The five bilateral landmarks were: 1) Condylion (Co); 2) Gonion (Go); 3) Articular fossa (AF); 4) Mesial surface of the maxillary first molar (Mx6); and 5) Mesial surface of the mandibular first molar (Mn6). Midline landmarks were pogonion (Po) and anterior nasal spine (ANS). The following linear measurements were made to determine mandibular skeletal and dentoalveolar asymmetry: 1) Condylion to gonion (Co-Go); 2) Gonion to pogonion (Go-Po); 3) Condylion to pogonion (Co-Po); 4) Condylion to mesial surface of mandibular first molar (Co-Mn6); and 5) Mesial surface of mandibular first molar to pogonion (Mn6-Po). Maxillary linear measurements were: 1) Articular fossa to anterior nasal spine (AF-ANS); 2) Mesial of maxillary first molar to anterior nasal spine (Mx6-ANS); and 3) Articular fossa to mesial of the maxillary first molar (AF-Mx6). All landmarks were identified and measurements made solely by the principal investigator (PI) using Dolphin Imaging 10.5 3D software application. All landmarks were marked and linear measurements made directly from coronal, axial and sagittal slices taken from pre-treatment CBCT images to determine skeletal and dentoalveolar asymmetry. Figure 1 illustrates the seven landmarks selected for the study. Figure 2 illustrates the mandibular linear measurements and Figure 3 the maxillary linear measurements. Power analysis determined that a sample size of 20 subjects per group would be able to detect significant differences in asymmetry between the Class II/1 and Class II/2 subdivision groups at the 95% confidence interval. A computer-generated list of random numbers was used to select the 20 subjects in each group from the available population of records meeting the inclusion criteria. The randomization sequence was created using Stata 9.0 (StataCorp, College Station, TX) statistical software.
Figure 2: Mandibular linear measurements (All measuements were made bilaterally in each subject): 1) Co-Go (Condylion-Gonion), 2) Go-Po (Gonion-Pogonion), 3) Co-Po (Condylion-Pogonion), 4) Co-Mn6 (Condylion- Mesial surface of mandibular first molar), and 5) Po- Mn6 (Pogonion-Mesial surface of mandibular first molar).
Intra-rater reliability was determined from a pilot study of the first ten Class II/1 records using eight landmarks (five in the mandible and three in the maxilla). The eight linear measurements were made at three different time points using coronal, axial and sagittal slices from the CBCTs of ten subjects. Mean values and standard deviations were determined from the measurements made on subjects’ right sides (chosen arbitrarily). Intra-rater reliability was calculated using the average standard deviation derived from the three linear measurements made for each individual subject to derive the intraclass correlation coefficient (ICC). After establishing intra-rater reliability of the PI, linear measurements were made bilaterally for each subject at three time intervals.
Average values and standard deviations were obtained for each measure. Absolute differences between right side and left side linear measurements in millimeters were calculated for each subject in each of the two groups, averaging the measurements from the three time points to provide a measure of overall asymmetry between right and left sides for each linear measure. Because the data were not normally distributed, the data were then arranged from lowest to highest and the median calculated. The data were tested using the Mann-Whitney U test. The data were organized to allow comparison of linear measures taken from the Class I side of the asymmetric malocclusion to the Class II side to determine which side was longer.
Results
The percentage of Division 1 and 2 malocclusions, as well as the percentage of Class II/1 and Class II/2 presenting with a subdivision malocclusion, was calculated. Two-hundred fourteen subjects were classified as Class II/1, with 49/214 (22.9%) having a subdivision malocclusion. Forty-two subjects were classified as Class II/2, with 21/42 (50%) having a subdivision malocclusion. Chi-Square analysis of the occurrences of subdivision occlusion revealed a highly significant difference (p<0.001) between Class II/1 and Class II/2 subdivision rates (Figure 4).
The pilot study showed that the intra-rater reliability of all linear measurements was acceptable. The intraclass correlation coefficient was 0.98 (95% one-sided lower-limit confidence interval). All mandibular measures exhibited increased side-toside differences in the Class II/2 subdivision group versus the Class II/1 subdivision group, although the differences were not statistically significant. The three maxillary measurements (AFANS, ANS-Mx6, and AF-Mx6) were not statistically different between Class II/1 subdivision and Class II/2 subdivision groups. No statistically significant side-to-side differences existed between Class II/1 subdivision subjects and Class II/2 subdivision subjects when adjusted for multiple comparisons (Table 1). The cut-off for significance was α=0.006 to correct for multiple comparisons (0.05/8=0.006).
| Variable | Class II Division 1 Subdivision Group | Class II Division 2 Subdivision Group | Cl II/1Subd vs.Cl II/2 Subd P value | ||||
|---|---|---|---|---|---|---|---|
| Median | Min | Max | Median | Min | Max | ||
| Co-Go | 1.63 | 0.4 | 5.37 | 2.07 | 0.43 | 5.13 | 0.473 |
| Go-Po | 1.08 | 0.27 | 4.07 | 1.5 | 0.27 | 3.6 | 0.144 |
| Co-Po | 1.08 | 0.37 | 3.8 | 2.07 | 0.67 | 5.33 | 0.009 |
| Co-Mn6 | 1.02 | 0 | 3.97 | 1.9 | 0.23 | 5.47 | 0.017 |
| Po-Mn6 | 0.58 | 0.17 | 1.73 | 0.73 | 0.17 | 1.97 | 0.665 |
| AF-ANS | 1.13 | 0.2 | 5.47 | 1.1 | 0.07 | 2.7 | 0.925 |
| ANS-Mx6 | 0.53 | 0.07 | 4.73 | 0.9 | 0.167 | 3.33 | 0.133 |
| AF-Mx6 | 1.27 | 0.1 | 2.57 | 1.07 | 0.2 | 1.7 | 0.675 |
Table 1: Descriptive statistics and comparisons of right-left absolute measurements (in mm) in Class II division 1 subdivision and Class II division 2 subdivision Groups using the Mann-Whitney U test, n=20.
The data was analyzed to compare differences in linear measurements between the Class I and Class II sides for each of the two groups (Table 2). Mann-Whitney U tests were applied to compare each linear measure for the two groups and were adjusted for multiple comparisons. The amount of Class I sideto- Class II side asymmetry was statistically significant for the measurement Co-Po. Although not significant, all mandibular measures were larger on the Class I side compared to the Class II side in the Class II/2 group. That is, in Class II/2 subdivision malocclusions, there were greater differences in linear measures when comparing the Class I side of subjects to the Class II side than in the Class II/1 group.
Variable |
Class II Division 1 Subdivision Group |
Class II Division 2 Subdivision Group |
Cl II/1 Subd vs.Cl II/2 Subd P value |
||||
|---|---|---|---|---|---|---|---|
| Median | Min | Max | Median | Min | Max | ||
| Co-Go | 0.67 | -2.47 | 4.37 | 1.77 | -5.14 | 3.44 | 0.607 |
| Go-Po | 0.52 | -2.2 | 4.07 | 1.27 | -1.63 | 3.6 | 0.304 |
| Co-Po | 0.85 | -1.4 | 3.8 | 2.05 | 0.7 | 5.3 | 0.003 |
| Co-Mn6 | 0.95 | -1 | 3.97 | 1.9 | 0.03 | 5.46 | 0.014 |
| Po-Mn6 | -0.16 | -1.74 | 1.66 | 0.21 | 2.07 | 1.53 | 0.433 |
| AF-ANS | -0.2 | -3.26 | 4.44 | 0.52 | -2.16 | 2.73 | 0.239 |
| ANS-Mx6 | 0.22 | -2.3 | 4.74 | -0.04 | -2.9 | 3.33 | 0.617 |
| AF-Mx6 | -0.04 | -2.57 | 1.77 | 0.37 | -1.44 | 1.7 | 0.234 |
Table 2: Differences in linear measurements between Class I and Class II sides for the two groups (Class II/1 subdivision and Class II/2 subdivision) using Mann-Whitney U test at a=0.006,n=20.Positive numbers indicate that the larger measurement was on the Class I side.
Discussion
Given the often stark morphological differences between a Class II/1 and Class II/2 malocclusion, it is a diagnostic oversimplification to group the two together as one in the same under the heading ‘Class II malocclusion.’ Sanders concluded that posteriorly positioned and shorter mandibles on the Class II side are the primary etiological factors in the occurrence of subdivision malocclusion [7]. Our results indicate the same, at least in regard to mandibular length, as there was an identifiable trend of decreased mandibular length on the Class II side in both Division 1 and Division 2 subdivision malocclusions. No comment could be made in regard to the antero-posterior positioning of the mandible itself, as in this study’s design, reference planes were not established.
The first objective of this study was to determine whether there was a higher prevalence of subdivision malocclusion in the Class II/2 type. The results indicate that a subdivision malocclusion was present in 50% of subjects with Class II/2 malocclusion compared to only 22.9% of Class II/1 malocclusions. This finding was highly significant (p<0.001) and suggest that asymmetry is at least one of the features that commonly characterize the Class II/2 malocclusion. More common morphological features include upright maxillary central incisors, deep bite, decreased mandibular plane angle, maxillomandibular hypodivergence and decreased lower face height [8-10]. The higher prevalence of subdivision malocclusions found in Class II/2 subjects supports our initial hypothesis, which was historically based on clinical observation. It is noteworthy that Edward Angle, over a century ago, thought there to be a higher instance of asymmetric occlusal relationships in Class II/2 malocclusion but there was no literature to support this observation. Angle estimated that up to 70% of Class II/2 patients present with a subdivision malocclusion [1]. Larger population studies would be needed to better estimate the true prevalence of subdivision in Class II/1 and Class II/2 populations.
The second objective of our study was to determine if the higher prevalence of subdivision malocclusion In Class II/2 was due to greater skeletal and/or dentoalveolar asymmetry. The results of this study indicate that there is greater mandibular asymmetry in the Class II/2 malocclusion population (versus Class II/1 malocclusion). By contrast, Minich observed in a similar study that the maxilla was positioned more anteriorly on the Class II side relative to cranial base, accounting for a significant amount of asymmetry in a sample of Class II/2 subjects [1]. Only one measurement of mandibular asymmetry proved significantly greater in the Class II/2 malocclusion group: Co-Po. The results from the remaining three mandibular measures also indicated greater asymmetry in the Class II/2 malocclusion group, but were not statistically significant. Co-Go is most indicative of ramus size. This measurement could help pinpoint an asymmetry due to a large ramus, asymmetrically long condylar neck or larger/ smaller condyle on one side. It would not indicate, however, which of these three problems is the culprit. Go-Po represents mandibular body length and could pinpoint an asymmetry in this portion [11]. Co-Po is a commonly used measurement for overall mandibular length and includes components of both Co-Go and Go-Po; therefore, it makes sense that if only one measurement would be significantly different in the mandible it would be Co- Po. Unfortunately Co-Po does not provide much insight into what specifically is asymmetric about the mandible. Li et al. [12] found that asymmetric position of the glenoid fossa was the most significant skeletal asymmetry in their investigation of asymmetries in Class II subdivision cases. From this measurement we cannot determine if the asymmetry is in the condyle, the condylar neck, the ramus, or the body. So, while Co-Go (ramus/ condyle size) and Go-Po (body length) were not statistically significant, when taking into account all parts of the mandible (Co-Po) produced a statistically significant difference. Given the nature of measuring small linear differences from the left to right side in different patients, considerable variation was expected, and with small sample size higher standard deviations were expected [13]. Because the data were not normally distributed, a nonparametric statistical test was used to compare differences in the medians [14]. In other studies, reference planes were established, thereby allowing mesio-distal position of the molar to be better assessed. Since reference planes were not established in this study, no definitive conclusions could be drawn regarding the mesiodistal position of maxillary and mandibular molars. The only significant finding when analyzing the data in this manner was Co-Po, a mandibular skeletal measurement.
Although the methods described in this study were accurate in the determining the existence of mandibular asymmetry, they would be impractical to apply routinely in the diagnostic process. There are inherent weaknesses that must be recognized. Without reference planes it is impossible to determine whether the molar is mesially or distally positioned in the craniofacial complex. For example, if it were determined that there is significant difference in the measurement Co-Mn6 between sides, it could be due to the asymmetry in the molar position itself or due to mandibular asymmetry. Therefore, we could not draw conclusions about the mesio-distal position of the maxillary or mandibular first molar. According to Sanders, a mesially positioned maxillary molar and a distally positioned mandibular molar on the Class II side were minor contributing factors in the etiology of subdivision malocclusions [7]. Furthermore, Minich’s study of asymmetries in Class II, Division II subdivision cases asserted that a major etiology of the asymmetry observed was dental in nature, due to a mesially positioned maxillary first molar and distally positioned mandibular first molar [11].
Another possible limitation was that only one evaluator made linear measurements. Previous studies, however, indicated that intra-rater reliability is an acceptable evaluation method [15,16]. The intra-rater reliability reported in the current study showed good reproducibility of measurements. One of the distinct advantages of this study was that using CBCT imaging eliminated magnification error in our linear measurements. Ludlow et al. showed that skull orientation and linear measurements in CBCT images was more accurate than cephalometric and panoramic techniques [17].
Conclusion
Within the parameters of this study, 256 patients met the inclusion criteria determined for Class II malocclusion. Of these, 83.6% (214/256) had Class II Division 1 malocclusion. The other 16.4% (42/256) had Class II Division 2 malocclusion. The prevalence of unilateral Class II malocclusion (i.e., subdivision malocclusions) was significantly greater in Class II Division 2 patients than in Class II Division 1 patients. Bilateral linear measurements using selected maxillary and mandibular skeletal and dental landmarks revealed a trend of greater mandibular asymmetry in patients with Class II Division 2 subdivision malocclusion. Every mandibular variable measured indicated a greater degree of mandibular asymmetry in the Class II Division 2 subdivision malocclusion group, with the measure Co-Po proving statistically significant. Linear measurements using the seven landmarks selected in this study can be made accurately, with good intra-rater reliability and would be acceptable for further study. Recent advances in the use of 3D volumetric analysis via CBCT make it possible to enable more accurate assessment of skeletal morphology, including skeletal asymmetries.
Acknowledgement
This project was supported by a funding award from the Air Force Surgeon General’s (AFSG) Intramural Clinical Investigations Program.
References
- Angle EH (1899) Classification of malocclusion. Dent Cosmos 4h248-64: 350-357.
- Blair ES (1954) A cephalometricroentgenographic appraisal of the skeletal morphology of Class I, Class II, Division 1, and Class II, Division 2 (Angle) malocclusions. Angle Orthod 24: 106-119.
- Renfroe ER (1948) A study of the facial patterns associated with Class I, Class II Division 1, and Class II Division 2 malocclusions. Angle Orthod 18: 12-15.
- Hellman M (1944) Diagnosis in orthodontia and the method I use in practice. Angle Orthod 13: 3-14.
- Kwon TG, Park HS, Ryoo HM, Lee SH (2006) A comparison of craniofacial morphology in patients with and without facial asymmetry: a three-dimensional analysis with computed tomography. Int J Oral MaxillofacSurg 35: 43-48.
- Berco M, Rigali PH Jr, Miner RM, DeLuca S, Anderson NK, et al. (2009) Accuracy and reliability of linear cephalometric measurements from cone beam computed tomography scans of a dry human skull. Am J OrthodDentofacialOrthop 136: 1-9.
- Sanders DA, Rigali PH, Neace WP, Uribe F, Nanda R (2010) Skeletal and dental asymmetries in Class II subdivision malocclusions using cone-beam computed tomography. Am J OrthodDentofacialOrthop 138: 1-20.
- Brezniak N, Arad A, Heller M, Dinbar A, Dinte A, et al. (2002) Pathognomonic cephalometric characteristics of Angle Class II Division 2 Malocclusion. Angle Orthod 72: 251-257.
- Peck S, Peck L, Kataja M (1998) Class II Division 2 malocclusion: A heritable pattern of small teeth in well-developed jaws. Angle Orthod 68: 9-20.
- Wallis SF (1963) Integration of certain variants of the facial skeleton in Class II division 2 malocclusion. Angle Orthod33: 60-67.
- Minich CM, Araujo EA, Behrents RG, Buschang PH, Tanaka OM, et al.(2013) Evaluation of skeletal and dental asymmetries in Angle Class II subdivision malocclusions with cone beam computed tomography. Am J OrthodDentofacialOrthop 144: 57-66.
- Li J, He Y, Wang Y, Chen T, Xu Y, et al. (2015) Dental, skeletal asymmetries and functional characteristics in ClassII subdivision malocclusions. J Oral Rehabil 42: 588-599.
- Norman GR,Streiner DL (2000) Biostatistics: The Bare Essentials (2ndedn.) Lewiston, B.C. Decker Inc.
- http: /allenfleishmanbiostatistics.com/Articles/2012/01/13-p-values-in-small-samples/
- Goldenberg DC, Alonso N, Goldenberg FC, Gebrin ES, Amaral TS, et al. (2007) Using Computed Tomography to evaluate maxillary changes after surgically assisted rapid palatal expansion. J Craniofacial Surg18: 302-311.
- Lagravere MO, Gordon J, Ines G, Flores-Mir C (2009) Reliability of traditional cephalometric landmarks as seen in three-dimensional analysis in maxillary expansion treatments. Angle Orthod 79: 1047-1056.
- Ludlow JB, Laster WS, See M, Bailey LJ, Hershey HG (2007) Accuracy of measurements of mandibular anatomy in cone beam computed tomography images. Oral Surg Oral Med Oral Pathol Oral RadiolEndod 103: 534-542.
Open Access Journals
- Aquaculture & Veterinary Science
- Chemistry & Chemical Sciences
- Clinical Sciences
- Engineering
- General Science
- Genetics & Molecular Biology
- Health Care & Nursing
- Immunology & Microbiology
- Materials Science
- Mathematics & Physics
- Medical Sciences
- Neurology & Psychiatry
- Oncology & Cancer Science
- Pharmaceutical Sciences
