Study of Setting Landmarks and Frequency Control on Digital Cephalogram
Noboru Demura,Miho Hasumoto and Taichi Demura
DOI10.21767/2469-2980.100057
Noboru Demura*, Miho Hasumoto and Taichi Demura
Orthodontic Division Of Oral-Facial Surgery, Kanazawa Medical University, 1-1 Daigaku, Uchinada, Kahoku, Ishikawa-920-0293, Japan
- *Corresponding Author:
- Demura N
Asociate Professor
Orthodontic Division Of Oral-Facial Surgery
Kanazawa Medical University
1-1 Daigaku, Uchinada, Kahoku, Ishikawa-920-0293, Japan
Tel: 81-76-286-2211 (4101)
E-mail: n-demura@kanazawa-med.ac.jp
Received Date: April 23, 2018; Accepted Date: April 30, 2018; Published Date: May 05, 2018
Citation: Demura N, Hasumoto M, Demura T (2018) Study of Setting Landmarks and Frequency Control on Digital Cephalogram. J Orthod Endod 4:7. DOI: 10.21767/2469-2980.100057
Abstract
We applied Fourier transformation to investigate characteristics of the space frequency in digital cephalogram and examined the appropriate image processing conditions. Research materials were lateral cephalograms taken on the first visit of patients, who underwent orthodontic treatment. The following 8 measurement points (Sella, Na, Or, Ptm, Ans, Pns, Po, Pog) were selected from the imported images. Image processing was performed using image analysis software (NIH Image). Fourier transformation was performed in the surrounding area (512×512 dot)of each measurement point. The relationship between space frequency and power spectrum was made based on the data obtained by conversion. The X-axis showed space frequency and the Y-axis showed power spectrum (concentration difference of the image). The space frequency character at each measurement point was evaluated. In results, the space frequency was 0.05-0.97 cycle/mm at all measurement points, suggesting a large power spectrum. It was found that the power spectrum change amount was small for all measurement points at a frequency band over 1.0 cycle/mm. The present study investigated the characteristics of the frequency band for the anatomical objects of the skull in the maxillofacial area using cephalogram. The anatomical objects investigated in the present study are used in orthodontic treatment. If the space frequency of the target objects is analyzed using the same method at each department, clear images of accentuated target objects can be obtained. The method used in the present study can be widely applied not only in the dental field, but also medical field.
Keywords
Cephalogram; Landmark identification; Frequency control; Fourier transformation
Introduction
In orthodontic dentistry, a cephalogram is used to analyze facial skeletal morphology. Digital technology has markedly progressed in recent years and digital radiography has been widely used in medicine. Digital radiography used in the medical field includes digital x-ray, MRI, and CT images. However, there have been few reports on image processing conditions and these conditions were arbitrarily set at each facility. Since the target subject is different depending on the department, it is difficult to use the same imaging condition. A high-precision image is important for accurate diagnosis; therefore, it is important to evaluate the imaging condition of the digital radiography to avoid oversight and misdiagnosis. If the imaging condition is not set properly, superior machines cannot work effectively. We have reported that digital cephalogram using CR allows arbitrary setting and changing of the space frequency; therefore, it is easy to see compared with film/screen cephalogram [1,2]. We applied Fourier transformation to investigate characteristics of the space frequency in digital cephalogram and examined the appropriate image processing conditions.
Materials and Methods
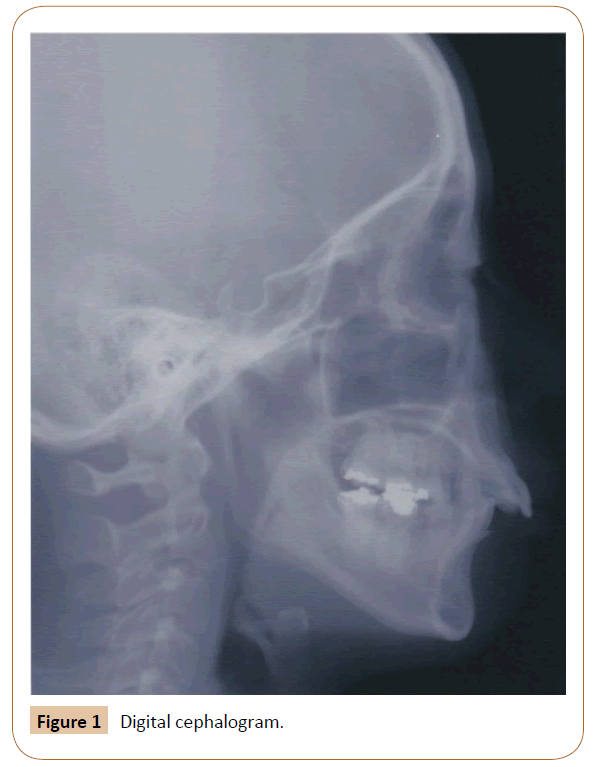
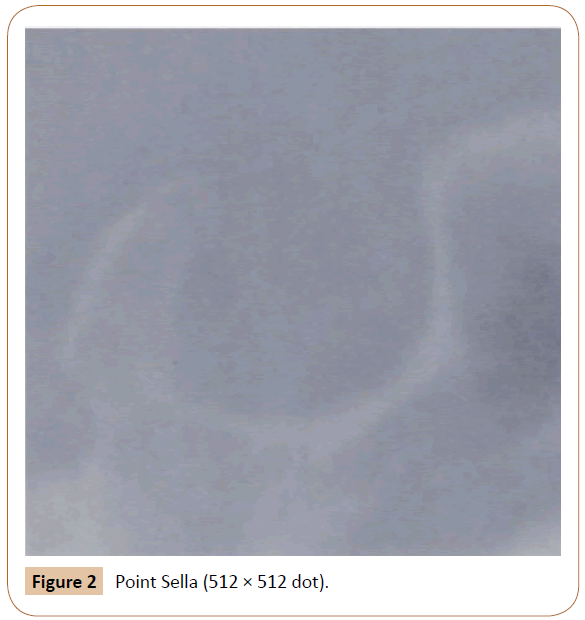
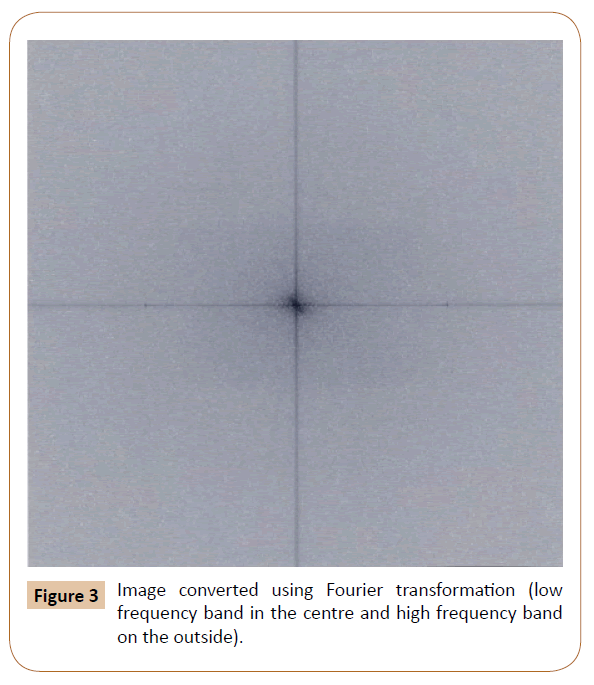
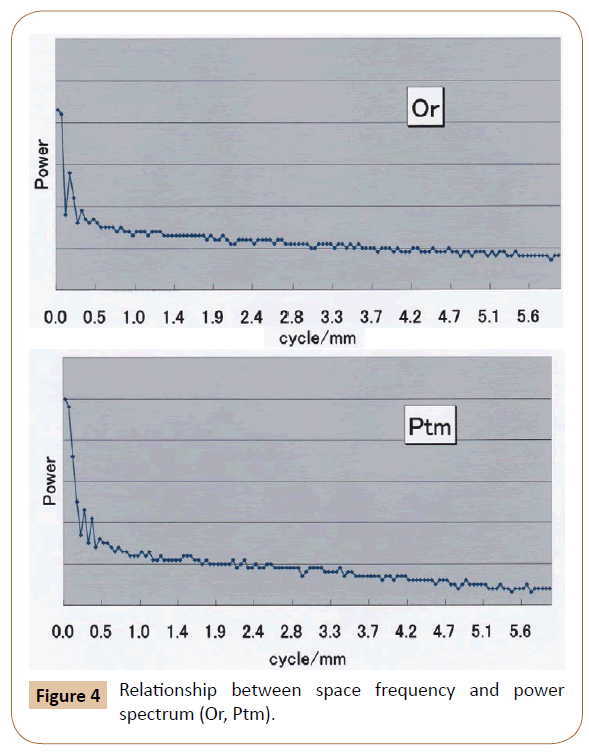
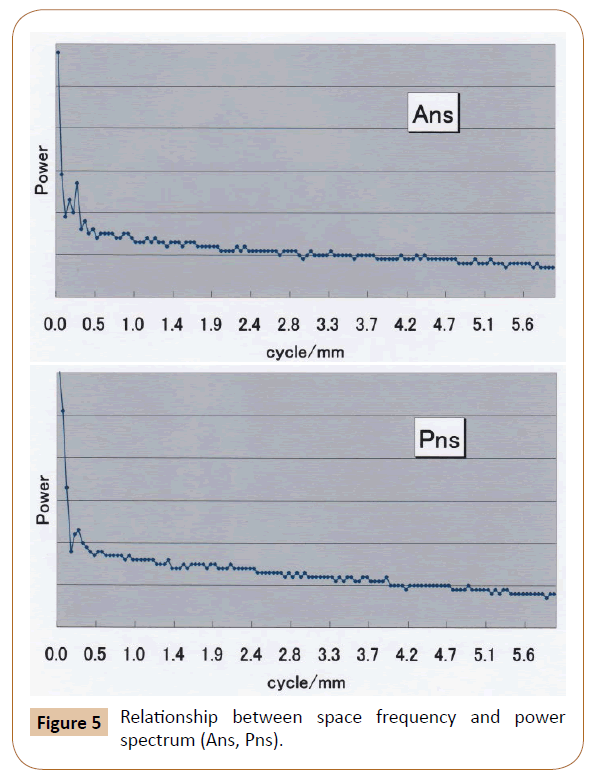
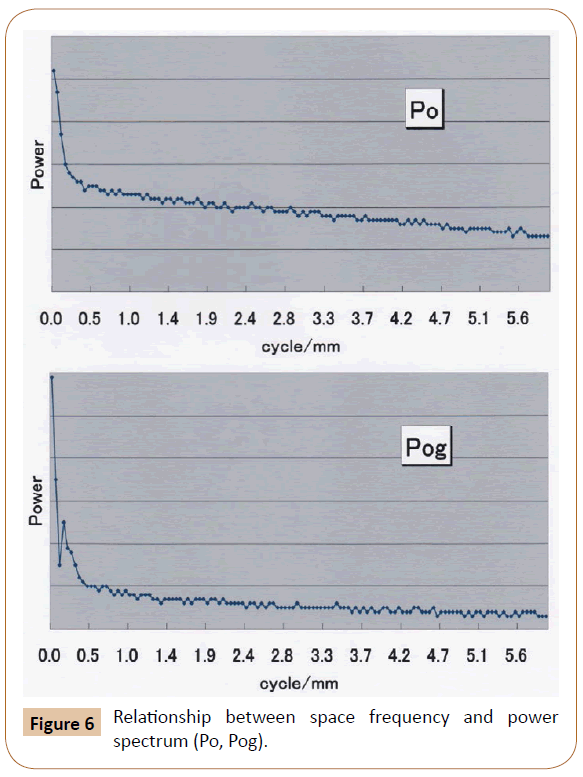
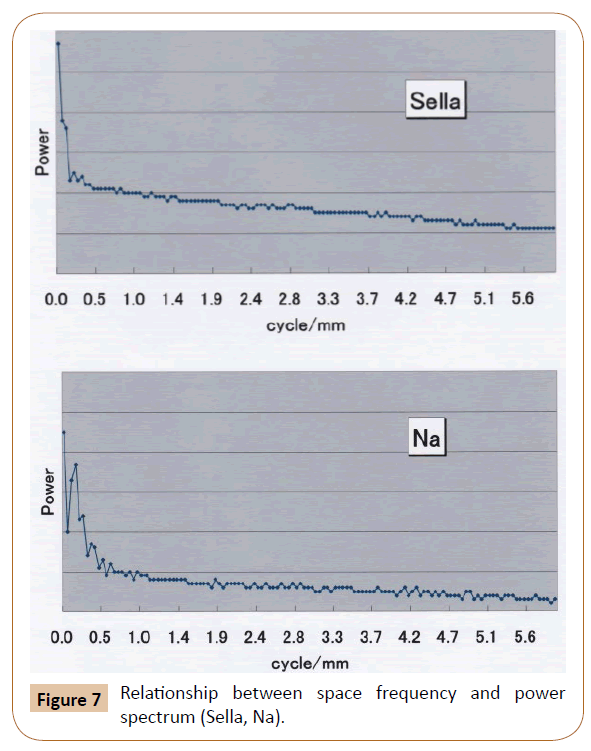
Research materials were lateral cephalograms taken on the first visit of patients, who underwent orthodontic treatment in the department of orthodontics at our clinic (Figure 1). The dose condition was 74 KVp, and irradiation time was automatic processing. Imaging condition was linear tone, each image coordinate was not stressed. Image processing was performed using image analysis software (NIH image). The following 8 measurement points : (Sella, Na, Or, Ptm, Ans, Pns, Po, Pog) were selected from the imported images. Fourier transformation was performed in the surrounding area (512 × 512 dot) of each measurement point (Figures 2 and 3). The graph showing the relationship between space frequency and power spectrum was made based on the data obtained by conversion. The X-axis showed space frequency and the Y-axis showed power spectrum (concentration difference of the image). The space frequency character at each measurement point was evaluated (Figures 4-7).
Results
Figures 4-7 are graphs showing the results at each measurement point. The space frequency was 0.05-0.97 cycle/mm at all measurement points, suggesting a large power spectrum. It was found that the power spectrum change amount was small for all measurement points at a frequency band over 1.0 cycle/mm.
Discussion
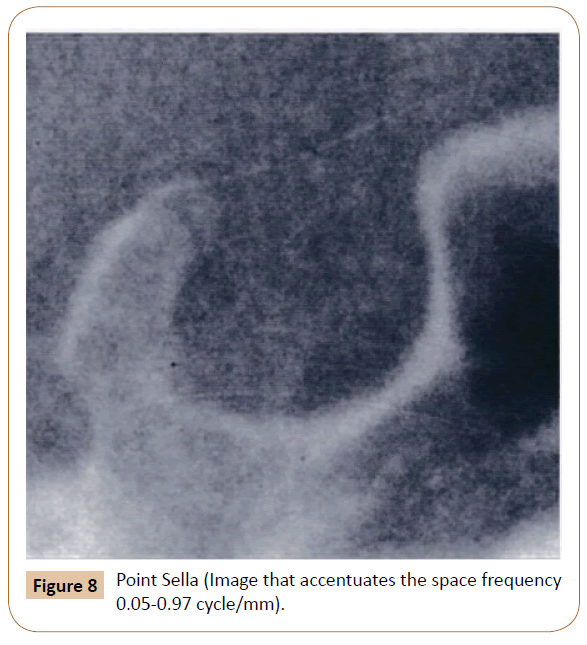
Figures 4-7 showed the results of 8 measurement points. The concentration difference of the image was accentuated by emphasizing space frequency of 0.05-0.97 cycle/mm and a clearer image was fabricated. Figure 8 shows the Sella image with accentuated space frequency. The present study investigated the characteristics of the frequency band for the anatomical objects of the skull in the maxillofacial area using cephalogram. The anatomical objects investigated in the present study are used in orthodontic treatment (Figure 8). If the space frequency of the target objects is analyzed using the same method at each department, clear images of accentuated target objects can be obtained. The method used in the present study can be widely applied not only in the dental field, but also medical field.
Fourier transformation
Fourier transformation is one of the data analysis methods to evaluate data, such as image and audio, objectively by using the Fourier transformation method. In short, it separates the layers of different frequency and demonstrates with respect to each frequency. It is used as an algorithm to convert time domain data to frequency domain data. The Fourier transformation is an important technology in signal processing, and used for spectrum analysis as a frequency analysis method. Digital images can be expressed as two-dimensional frequency signals by using Fourier transformation; therefore, it is used for image processing [3,4].
Conclusion
The space frequency was 0.05-0.97 cycle/mm at all measuzrement points, suggesting a large power spectrum. It was found that the power spectrum change amount was small for all measurement points at a frequency band over 1.0 cycle/mm. The present study investigated the characteristics of the frequency band for the anatomical objects of the skull in the maxillofacial area using cephalogram. The anatomical objects investigated in the present study are used in orthodontic treatment. If the space frequency of the target objects is analyzed using the same method at each department, clear images of accentuated target objects can be obtained. The method used in the present study can be widely applied not only in the dental field, but also medical field.
Declarations
Ethics approval and consent to participate. This study was perfomed in accordance with the Declaration of Helshinki, and carried out with the approval of the Ethics Committee of the Kanazawa Medical University (Registration number: I-222).
Availability of Data and Materials
The datasets used and/or analyzed during the current study are available from the corresponding authors on reasonable request.
Competing Interests
The authors declare that they have no competing interest.
Funding
No funding has been received for this study.
Conflict of Interest
The authors declare that they have no conflict of interest.
References
- Broadbent BH (1931) A new x-ray techinique and its application to orthodontia. Angle Orthod 1: 45-66.
- Demura N, Thurusako Y, Segami N (2001) Characteristics of digital cephalograms and film/screen cephalograms: A comparative study. J Clin Orthod 2: 350-355.
- Won Moon (2013) Shortcomings of cephalometric analysis and utilization of novel 3D surface mapping technology and elliptical Fourier descriptors to evaluate craniofacial morphology. Dental Medicine Research 33: 361-370.
- Lestrel PE, Cesar Jr RM, Takahashi O, Kanazawa E (2004) A Fourier-wavelet representation of 2-D shapes: Sexual dimorphism in Japanese cranial base. J Anthropol Sci 112: 3-28.
Open Access Journals
- Aquaculture & Veterinary Science
- Chemistry & Chemical Sciences
- Clinical Sciences
- Engineering
- General Science
- Genetics & Molecular Biology
- Health Care & Nursing
- Immunology & Microbiology
- Materials Science
- Mathematics & Physics
- Medical Sciences
- Neurology & Psychiatry
- Oncology & Cancer Science
- Pharmaceutical Sciences
