Study on Errors of Cephalographic Measurement Points
Noboru Demura, Miho Hasumoto and Taichi Demura
DOI10.21767/2469-2980.100056
Noboru Demura*, Miho Hasumoto and Taichi Demura
Orthodontic Division of Oral-Facial Surgery, Kanazawa Medical University, 1-1 Daigaku, Uchinada, Kahoku, Ishikawa-920-0293, Japan
- *Corresponding Author:
- Demura N
Asociate Professor
Orthodontic Division of Oral-Facial Surgery
Kanazawa Medical University 1-1 Daigaku, Uchinada, Kahoku, Ishikawa-920-0293, Japan
Tel: 81-76-286-2211 (4101)
E-mail: n-demura@kanazawa-med.ac.jp
Received Date: April 18, 2018; Accepted Date: April 25, 2018; Published Date: May 03, 2018
Citation: Demura N, Hasumoto M, Demura T (2018) Study on Errors of Cephalographic Measurement Points. J Orthod Endod 4:6. doi: 10.21767/2469-2980.100056
Abstract
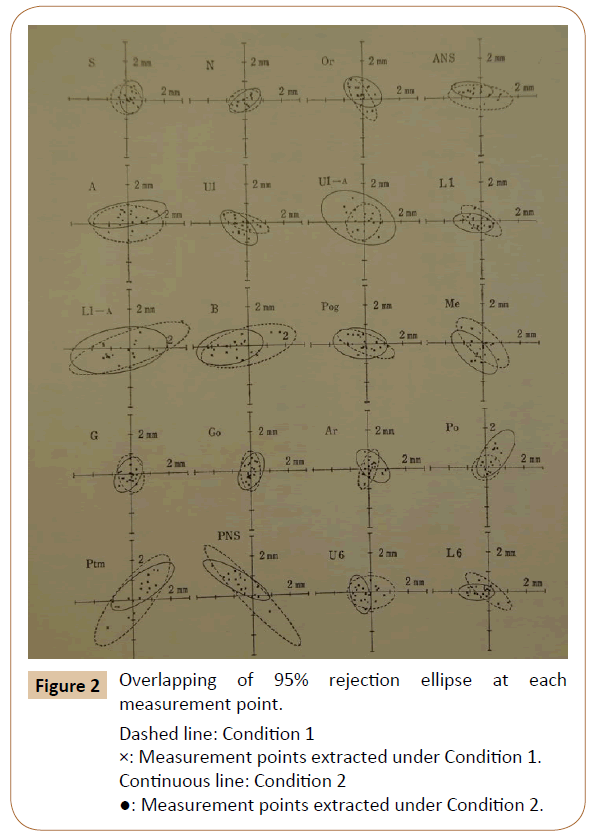
For accurate diagnosis using CR cephalographic measurement points, it is very important to establish image processing conditions under which accurate measurement points can be input. We produced 2 types of CR cephalograms. Image enhancement was performed in one type and not performed in the other type. After establishing the same 20 measurement points, we indicated the error of the measurement points between the 2 types as an area of rejection ellipse, and evaluated measurement errors caused by differences in image processing conditions. From the data obtained, we produced a 95% rejection ellipse and evaluated measurement-point establishment errors from the mean value using vector quantities in 2 types. From regarding measurement points under both conditions, rejection ellipses of the measurement points of S, N, Or, U1, L1, G, Go, and Ar were comparatively small, and Ptm and Pns had narrow large rejection ellipses. The area of rejection ellipse was small at 12 of 20 measurement points on the image-processed cephalogram. It was revealed that input errors of many measurement points are low with frequency-processed cephalograms. In particular, because frequency processing can decrease the establishment errors of cephalometric measurement points, appropriate establishment of frequency processing should be performed.
Keywords
CR (Computed Radiography); Cephalogram; Landmark identification
Introduction
In clinical orthodontic treatment, maxillofacial morphology has been analyzed using cephalometric radiograms (cephalograms) [1]. For morphological measurements, specific measurement points on cephalograms are established, and orthodontists input the measurement points on cephalograms, then calculate the distance between the measurement points and angles. In recent years, although cephalograms using digital imaging Computed Radiography (CR) [2], known as CR cephalograms, have been applied, it is necessary to input highly reproducible accurate measurement points because the images are arbitrarily produced by setting image processing conditions. Therefore, the evaluation of highly accurate image processing conditions is important. Image processing conditions for CR usually differ among hospitals and clinics, and some large hospitals can provide the same image processing conditions at any site through every department. However, even under the same image processing conditions as other departments, the input of measurement points may become inaccurate because morphological measurement is performed using cephalograms. Therefore, for accurate diagnosis using CR cephalographic measurement points, it is very important to establish image processing conditions under which accurate measurement points can be input.
In the present study, we produced 2 types of CR cephalograms. Image enhancement was performed in one type and not performed in the other type. After establishing the same measurement points, we indicated the error of the measurement points between the 2 types as an area of rejection ellipse and evaluated measurement errors caused by differences in image processing conditions.
Materials and Methods
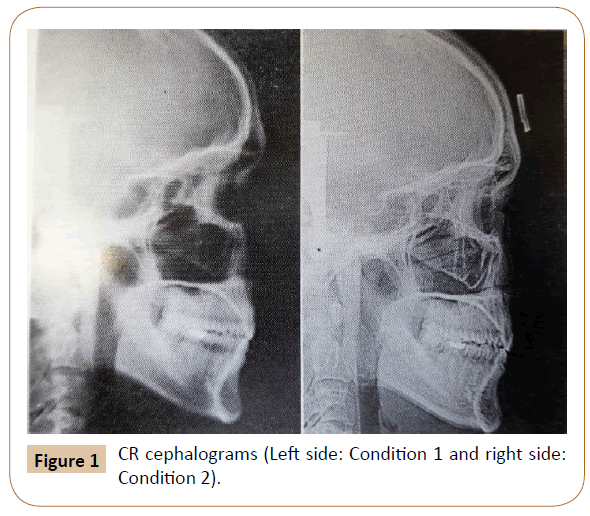
The study materials were 2 types of CR cephalograms of an orthodontic patient in our department. Although, gradation processing was straight gradation in both types, frequency processing and image enhancement were performed in one type (condition 2), and frequency processing was not performed in the other type (condition 1), as follows:
(1).Condition 1: Gradation processing was straight gradation, frequency processing type was R, Frequency Rank (RN) was 6, and degree of enhancement (RE) was 8.
(2).Condition 2: Gradation processing was straight gradation and frequency processing type was RT T (Figure 1).
X-ray imaging conditions were 74 KV, 80 mA, and auto-exposure time. For the images obtained, an orthodontist (Kanazawa Medical College, Department of Oral Surgery, orthodontic experience of 30 years) input measurement points on the PC display. The following 20 measurement points were established.
S, N, Or, ANS, A, U1, U1-A, L1, L1-A, B, Pog, Me, G, Go, Ar, Po, Ptm, PNS, u6, and L6
Each measurement point was input and saved in the PC using cephalometric image analysis software. The data were accumulated and coordinate transformation was performed. On each film, the intersection connecting (1) mean S coordinate and mean Pog coordinate, and (2) mean N coordinate and mean Go coordinate was set as the origin, and data was converted into a coordinate system, in which Go-N overlaps the X-axis. From the data obtained, we produced 95% rejection ellipse and evaluated measurement-point establishment errors from the mean value using vector quantities [3].
Results
In Figure 2, (1) shows the 95% rejection ellipse (continuous line) under condition 1, and (2) shows the 95% rejection ellipse (dashed line) under condition 2. Table 1 shows the measured area of each rejection ellipse. From Figure 2, regarding measurement points under both conditions, rejection ellipses of the measurement points of S, N, Or, U1, L1, G, Go and Ar were comparatively small, and Ptm and Pns had narrow large rejection ellipses. From the results in Table 1, the area of rejection ellipse was small at 12 of 20 measurement points on the image-processed cephalogram.
| Condition 1 | Condition 2 | |||||||
|---|---|---|---|---|---|---|---|---|
| Measurements points | Mean X | Mean Y | Overlapping of 95% rejection ellipse | Mean X | Mean Y | Overlapping of 95% rejection ellipse | Hotelling T2 value | Vector F value |
| S | 13.2 | -43.34 | 1.877 | 12.55 | -44.76 | 1.677° | 2.66 | 0.02 |
| N | 68.1 | 0 | 1.678 | 66.98 | 0 | 1.299° | 0 | 0.08 |
| 0r | 37.2 | 13.86 | 1.788° | 37.88 | 12.11 | 2.322 | 3.74 | 0.02 |
| Ans | 28.21 | 36.88 | 3.368 | 25.67 | 36.71 | 1.366° | 7.88** | 3.31 |
| A | 23.23 | 37.98 | 5.528 | 23.42 | 38.01 | 4.112° | 5.44 | 0.11 |
| U 1 | 12.8 | 53.98 | 1.544° | 13.31 | 53.99 | 2.322 | 8.54** | 0.02 |
| U1 -A | 22.2 | 33.86 | 2.655° | 22.39 | 34.31 | 8.307 | 0.77 | 4.71** |
| L1 | 12.21 | 53.88 | 1.966 | 11.98 | 53.01 | 1.688° | 4.67 | 0.72 |
| L1 -A | -8.71 | 57.87 | 8.935° | -9.58 | 54.81 | 9.031 | 0.54 | 0.81 |
| B | -7.21 | 57.98 | 7.876 | -8.55 | 58.21 | 5.045° | 3.12 | 1.02 |
| Pog | -19.82 | 67.23 | 2.752° | -22.11 | 67.01 | 3.713 | 0.69 | 0.02 |
| Me | -25.77 | 63.38 | 3.866 | -27.21 | 64.03 | 3.312° | 13.00** | 0.12 |
| G | -43.75 | 0.07 | 1.877 | -45.58 | 0.08 | 1.923° | 0.52 | 0.05 |
| Go | -42.27 | 0 | 1.768° | -43.22 | 0 | 1.992 | 0.04 | 0.02 |
| Ar | -18.19 | -35.88 | 1.532° | -17.98 | -34.98 | 2.121 | 1.88 | 0 |
| Pog | -18.98 | -50.89 | 1.522° | -16.92 | -53.08 | 2.897 | 8.77** | 2.12 |
| Ptm | 3.55 | -9.44 | 8.322 | 3.78 | -11.03 | 4.032° | 2.07 | 1.88 |
| Pns | -3.35 | -1.21 | 6.543 | -4.32 | -1.98 | 3.232° | 2.29 | 1.22 |
| U6 | -6.78 | 25.88 | 3.762 | -7.28 | 26.03 | 1.723° | 4.98 | 2.01 |
| L6 | -5.98 | 27.69 | 2.085 | -6.54 | 28.89 | 1.256° | 8.22** | 0.75 |
°Shown next to the area of the 95% rejection ellipse represents the area with lower error distribution
** Next to the F value of Hotelling T2 indicates 99% significant difference
* Next to the vector amount for the F-value test indicates 95% significant difference
Table 1: The area of rejection ellipse under each processing condition.
Discussion
The results in Table 1 demonstrate that the area of rejection ellipse was small at 12 of 20 measurement points on the image-processed cephalogram. This revealed that accurate measurement points can be established when image processing, such as frequency processing, was performed. In the CR system, gradation and frequency processing conditions are generally adjustable. Gradation processing is the adjustment of contrast, in which 4 parameters are present [4].
Gradation Type (GT)
In the CR system, 15 types of gradation curves are input and set in advance. Among these, gradation type A is straight gradation; the other types present curve gradations, and black-and-white reversal images can be readily produced.
1. Gradation rotation amount (GA): This indicates the inclination of gradation curves, consisting of numbers between -4 and +4. The inclination of gradation curves becomes higher with the numbers. When the value is negative, the gradation curves are reversed, causing black-and-white reversal images.
2. Gradation rotation center (GC): This is the center of rotation at the time of the rotation of the gradation curves, which can be set in the concentration regions between 0.3-2.6.
3. Gradation shifting amount (GS): Contrast is adjusted by shifting the gradation curve parallel to the vertical axis direction. In the present study, we selected straight gradation. This was because no differences in the improvement in the measurement points were confirmed when gradation processing was changed in our previous studies [5]. Frequency processing is the control of sharpness, in which 3 parameters are present.
4. Frequency rank (RN): This consists of numbers between 0 and 9, classified into low – (0-3), intermediate – (4-5), and high – frequency ranks (6-9). The maximum response frequency band varies with the number. When the high-frequency rank is selected, small structures (lines) can be enhanced more with decreases in the size of the structures.
5. Frequency type (RT): Eight types are established, representing the rate (coefficient) of enhancement in each concentration region. In general, when soft tissue is diagnosed, type R, in which the strength in the low concentration region is set to low, is selected. When hard tissue is diagnosed, type T, in which the strength in the low concentration region is set higher, is selected.
6. Degree of enhancement: This consists of numbers between 0 and 16. When the value is higher, the enhancement of non-sharp mask images becomes higher. Although, the accuracy of measurement varies with the establishment conditions of frequency processing, when enhancement is too high, images become unclear because noise on the images is also enhanced, and the establishment of measurement points becomes difficult. Regarding cephalographic X-ray imaging conditions, we manipulated the frequency processing, fixing the gradation processing to straight gradation, and evaluated processing conditions. Frequency processing is important for the establishment of cephalometric measurement points because optic visibility of anatomical structures becomes higher.
Conclusion
It was revealed that input errors of many measurement points are low with frequency-processed cephalograms. In particular, because frequency processing can decrease the establishment errors of cephalometric measurement points, appropriate establishment of frequency processing should be performed.
Declarations
All procedures followed were in accordance with the ethical standards of the responsible committee on human experimentation (institutinal and national) and with the Helsinki Declaration of 1975, as revised in 2008 (5). This study was perfomed in accordance with the Declaration of Helsinki and carried out with the approval of the Ethics Committee of the Kanazawa Medical University (resistration number:1211). Informed consent was obtained from all patients for being included in the study.
Availability of Data and Materials
The datasets used and/or analyzed during the current study are available from the corresponding authors on reasonable request.
Competing Interests
The authors declare that they have no competing interest.
Funding
No funding has been received for this study.
Conflict of Interest
The authors declare that they have no conflict of interest.
References
- Iizuka T, Ishikawa F (1957) Points and landmarks in head plates. Journal of Japan Orthodontic Society 16: 66-75.
- Takano M (2007) Remember of 30 years from the conception of CR system to the making to business. Japanese Society of Radiological Technology 64: 343-359.
- Burington RS, May DC (1975) A Handbook of Probability and Statics with Tables. Morikita Publishing, Tokyo, Japan, pp: 119-139.
- Fuji Film Co. (1988) Fuji Computed Radiography Application. Tokyo, Japan.
- Demura N, Koubayashi S, Nakagawa M, Syoda M, Susam R (1994) An appraisal of image processing procedures of cephalogram in computed radiography system. Journal of Japan Orthodontic Society 53: 57-65.
Open Access Journals
- Aquaculture & Veterinary Science
- Chemistry & Chemical Sciences
- Clinical Sciences
- Engineering
- General Science
- Genetics & Molecular Biology
- Health Care & Nursing
- Immunology & Microbiology
- Materials Science
- Mathematics & Physics
- Medical Sciences
- Neurology & Psychiatry
- Oncology & Cancer Science
- Pharmaceutical Sciences


