Tooth Size Discrepancy among Different Malocclusion Groups in a Sudanese Sample
Mahmoud NM, Eltahir HE and Mageet AO
DOI10.21767/2469-2980.100044
Mahmoud NM1, Eltahir HE1 and Mageet AO2*
1Orthodontic Resident at Mageet Orthodontic Training Center, University of Gezira, Sudan
2Mohammed Bin Rashid University, Dubai, United Arab Emirates
- *Corresponding Author:
- Mageet AO
Associate Professor of Orthodontics
Mohammed Bin Rashid University
Dubai, United Arab Emirates
Tel: +971-5533-78730
E-mail: amageet2000@yahoo.co.uk
Received Date: June 28, 2017; Accepted Date: July 17, 2017; Published Date: July 25, 2017
Citation: Mahmoud NM, Eltahir HE, Mageet AO (2017) Tooth Size Discrepancy among Different Malocclusion Groups in a Sudanese Sample. J Orthod Endod. 3:10. doi: 10.21767/2469-2980.100044
Abstract
Introduction: The standard model of orthodontic treatment can be divided into three different stages as stated by Proffit, namely leveling and alignment, working and finishing phases. Each of these presents different challenges. In particular the final, or “finishing” phase, constitutes the most complicated for the complexity of the various factors that need to be taken into account if an optimum result is to be achieved at the end of treatment. One of these factors, often a primary cause of difficulty, is Tooth Size Discrepancy (TSD). Problems arising from this can be alleviated if the existence of TSD forms part of the initial diagnosis and is considered when formulating a treatment plan for the individual patient.
Objectives: The present research aimed at determining the extent and prevalence in a representative orthodontic population in Sudan and to investigate the dimensions of TSD in this population that comprised a clinically significant factor.
Materials and methods: The sample comprised 107 pretreatment study casts with fully erupted and complete permanent dentitions from first molar to first molar, which were selected randomly from records of the orthodontic patients. The mesiodistal diameters of the teeth were measured at contact points using a stainless steel digital caliper and Bolton analysis was carried out on them.
Results: A clinically and statistically significant anterior TSD (p=0.002) existed in comparison to Bolton’s anterior tooth ratio. Measurements of the overall and anterior TSD between malocclusion groups showed no significant differences (P=0.572, P=0.976 respectively). In terms of gender, no significant differences were observed for the overall TSD data (P=0.102). In Class II division 1 mean overall ratio was lower than Bolton’s, and Class II division 2 mean overall ratio higher than Bolton’s [overall ratio (91.3%, SD ± 2), anterior ratio (77.2, SD ± 2)].
Conclusion: Class II division 1 patients showed a tendency towards excessive maxillary tooth material and Class II division 2 patients showed a tendency towards excessive mandibular tooth material.
Keywords
Tooth size discrepancy; Bolton analysis; Bolton ratio, Crowding of teeth
Introduction
TSD is defined as the lack of harmony of size of individual tooth or groups of teeth when related to those within the same arch or the opposing arch [1]. It can also be defined as a relative excess of tooth structure in one arch in relation to the other arch [2]. Ideal orthodontic treatment results with optimal occlusion and ideal intercuspation (Class I incisors, canine and molar relationship). Over jet and overbite is jeopardized by tooth size discrepancy [2]. For good occlusion, the upper and lower teeth must be proportional in size. If large upper teeth are combined with small lower teeth, as in a denture setup with mismatched sizes, there is no way to achieve ideal occlusion. Although the natural teeth match very well right and left in most individuals, approximately 5% of the population shows some degree of disproportionately among the sizes of individual teeth [3] e.g. the upper lateral incisors (Peg lateral in one side).
Many clinicians have realized the importance of TSD. G.V. Black was the first to formally investigate the mesio-distal widths of teeth [4]. He measured a large number of human teeth and set up tables of mean dimensions, which are still used today as reference.
Comparison between the mesio-distal widths of teeth with the opposing corresponding tooth on the other side of the dental arch carried out by Ballard [5]. His results indicated that 90% of his sample showed a right left discrepancy in mesio-distal width equal to or exceeding 0.25 mm. His suggested solution was the stripping of proximal surfaces when a lack of balance existed.
Bolton’s [6,7] method in diagnosing TSDs by analyzing the mesio distal tooth width ratio between the maxillary and mandibular teeth has been widely used since its publication.
Various studies have studied sex differences in relation to TSD. Bishara [8] found that males have larger teeth than females. Despite the difference most studies have found that there is little impact of gender on interarch ratios [8-13]. Smith et al. found that males had a larger ratio than females but the differences were small and much less than one SD from Bolton norms [14].
Lavelle [15] showed interest in determining if patients with differing malocclusion groups have different norms of Interarch Tooth Size Discrepancy (ITSD). He found that patients with Angle Class III malocclusions tend to have higher ITSD than Class I or II patients. Araujo and Souki [9] studied 100 patients in each malocclusion and found that Class I and III patients had greater ITSD than Class II patients. They also found that Class III patients had more anterior ITSD than Class I and II patients. However many studies have found no differences in ITSD between malocclusion groups [13,14,16,17].
Aim of the Study
The present study aimed to investigate the extent of TSD in a representative Sudanese orthodontic population and to attempt to determine the size of the discrepancy in millimeters that constituted a clinically significant difference.
Materials and Methods
From 107 pretreatment sets of orthodontic study models at Mageet specialized dental clinic in Khartoum, Sudan, models were identified that fulfilled the following criteria:
• All permanent teeth have erupted.
• Subjects from Sudanese ethnic background determined from case records.
• No retained primary teeth.
• No abnormal tooth morphology.
• No previous orthodontic treatment.
• No factors which prevented accurate measurement of mesiodistal tooth widths including tooth restorations, fractured teeth, or broken teeth on models.
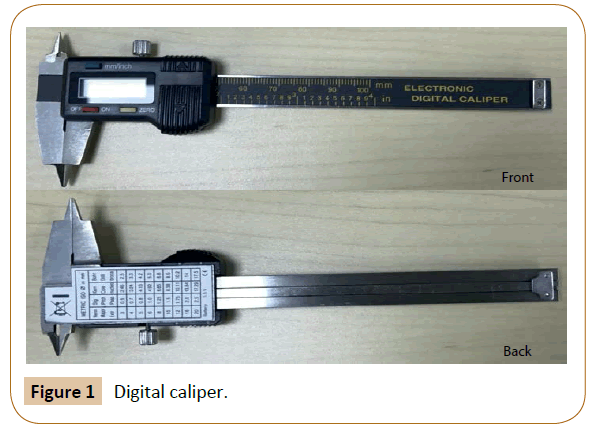
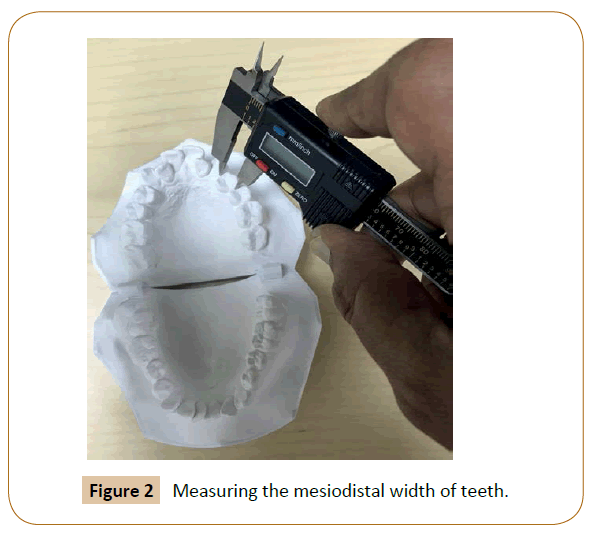
• The measurement is repeated one month after the initial measurements for 30 models to assure accuracy (the margin of error was 0.05 mm)-digital caliber (Figures 1 and 2).
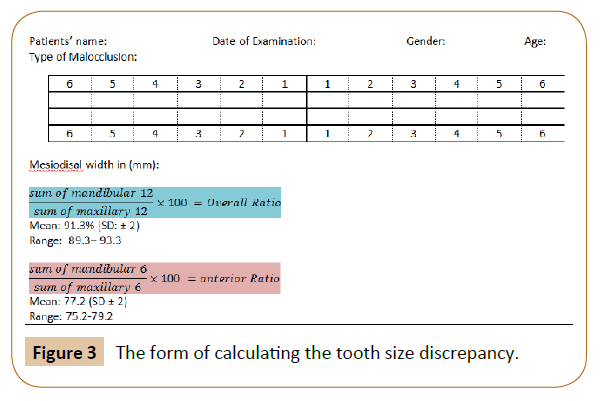
• The mesiodistal widths of 12 maxillary teeth and 12 mandibular teeth from right first molar to left first molar are totaled and compared. These mesio-distal crown measurements were taken from mesial and distal contact areas, respectively (Figure 3). The dividend of two is the percentage relationship of mandibular to maxillary tooth size, which is called “overall ratio”.
Results
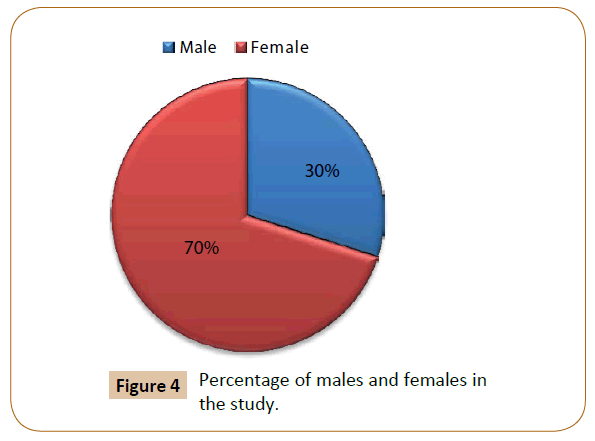
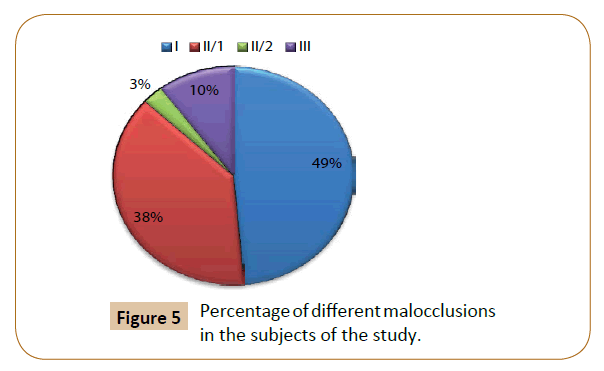
There are more of females in the Orthodontic patients’ sample in Sudan than the males as shown in Figure 4. Figure 5 shows increase percentage of Class I and Class III malocclusions while the percentage is decreased in Class II/1 and Class II/2 malocclusions in the sample.
Descriptive statistics of mesiodistal tooth width compared to with the different malocclusion groups. ANOVA demonstrated that there were significant differences in upper right lateral incisor, upper right canine, upper left second premolar and lower right central incisor mesiodistal widths in the different malocclusion groups.
Table 1 compares the mean and standard deviation of the width of the maxillary and mandibular teeth in the right and left sides. Statistically significant differences were found in maxillary central and lateral incisors and mandibular central incisors and canines. Table 2 reports the mean and standard deviation of the width of the maxillary and mandibular teeth in the male and female groups. Both male and female measurements follow a similar pattern distribution with the males having slightly larger dental dimensions except upper left first premolar. There were statistically significant differences in mesiodistal tooth width in upper right and left canine, lower right central incisor and lower right canine.
| Arches | Tooth | Right | Left | P-value | ||
|---|---|---|---|---|---|---|
| Mean | SD | Mean | SD | |||
| Maxillary | 1 | 9.10 | 0.68 | 90.00 | 0.68 | 0.002 |
| 2 | 7.32 | 0.65 | 70.23 | 0.65 | 0.004 | |
| 3 | 8.13 | 0.46 | 80.09 | 0.48 | 0.107 | |
| 4 | 7.45 | 0.57 | 70.50 | 0.59 | 0.230 | |
| 5 | 7.21 | 0.54 | 70.20 | 0.60 | 0.795 | |
| 6 | 10.72 | 1.10 | 10.84 | 0.63 | 0.226 | |
| Mandibular | 1 | 5.75 | 0.51 | 5.69 | 0.52 | 0.012 |
| 2 | 6.23 | 0.48 | 6.29 | 0.46 | 0.061 | |
| 3 | 7.15 | 0.57 | 7.06 | 0.57 | 0.034 | |
| 4 | 7.50 | 0.59 | 7.51 | 0.59 | 0.874 | |
| 5 | 7.65 | 0.56 | 7.60 | 0.57 | 0.324 | |
| 6 | 11.27 | 0.74 | 11.32 | 0.75 | 0.222 | |
Table 1: Comparison between right and left mesiodistal tooth width in the sample.
| Quadrants | Tooth | Male | Female | P-value | ||
|---|---|---|---|---|---|---|
| Mean | SD | Mean | SD | |||
| Maxillary right | 11 | 9.29 | 0.65 | 9.02 | 0.67 | 0.821 |
| 12 | 7.43 | 0.54 | 7.27 | 0.68 | 0.224 | |
| 13 | 8.33 | 0.49 | 8.05 | 0.42 | 0.014 | |
| 14 | 7.68 | 0.50 | 7.35 | 0.57 | 0.441 | |
| 15 | 7.40 | 0.60 | 7.13 | 0.49 | 0.107 | |
| 16 | 11.00 | 0.56 | 10.61 | 1.25 | 0.246 | |
| Maxillary left | 21 | 9.26 | 0.67 | 8.90 | 0.66 | 0.892 |
| 22 | 7.32 | 0.60 | 7.19 | 0.67 | 0.443 | |
| 23 | 8.26 | 0.53 | 8.01 | 0.44 | 0.011 | |
| 24 | 7.68 | 0.54 | 8.49 | 9.32 | 0.292 | |
| 25 | 7.37 | 0.55 | 7.12 | 0.61 | 0.611 | |
| 26 | 11.12 | 0.67 | 10.72 | 0.58 | 0.572 | |
| Mandibular left | 31 | 5.84 | 0.46 | 5.62 | 0.53 | 0.112 |
| 32 | 6.40 | 0.48 | 6.24 | 0.44 | 0.214 | |
| 33 | 7.25 | 0.55 | 6.98 | 0.56 | 0.126 | |
| 34 | 7.85 | 0.48 | 7.37 | 0.58 | 0.139 | |
| 35 | 7.60 | 0.61 | 7.60 | 0.55 | 0.590 | |
| 36 | 11.80 | 0.62 | 11.12 | 0.71 | 0.577 | |
| Mandibular right | 41 | 5.92 | 0.42 | 5.68 | 0.53 | 0.005 |
| 42 | 6.34 | 0.51 | 6.19 | 0.46 | 0.061 | |
| 43 | 7.33 | 0.62 | 7.08 | 0.53 | 0.021 | |
| 44 | 7.78 | 0.49 | 7.38 | 0.59 | 0.309 | |
| 45 | 7.76 | 0.60 | 7.60 | 0.53 | 0.940 | |
| 46 | 11.67 | 0.66 | 11.10 | 0.72 | 0.814 | |
Table 2: Difference in tooth size and tooth size discrepancy in the sample.
Table 3 shows the mean, standard deviations of the anterior and overall tooth size ratios in males and females. ANOVA demonstrated no significance in the male/female comparison.
| Tooth size discrepancy | Males | Females | P-value | ||
|---|---|---|---|---|---|
| Mean | SD | Mean | SD | ||
| Anterior Ratio | 78.34 | 2.76 | 78.30 | 3.87 | 0.949 |
| Overall Ratio | 91.82 | 2.50 | 90.87 | 2.81 | 0.102 |
Table 3: Anterior ratio and overall ratio of tooth size discrepancy of males and females.
Table 4 summarizes the mean values and standard deviations of the anterior and overall tooth size ratios in the malocclusion groups. ANOVA demonstrated that there were no significant differences in anterior and overall tooth size ratios among the malocclusion groups.
| Tooth size discrepancy | Class I | Class II/1 | Class II/2 | Class III | P-value | ||||
|---|---|---|---|---|---|---|---|---|---|
| Mean | SD | Mean | SD | Mean | SD | Mean | SD | ||
| Anterior Ratio | 78.44 | 2.91 | 78.11 | 4.49 | 78.57 | 1.53 | 78.37 | 3.16 | 0.976 |
| Overall Ratio | 91.37 | 2.98 | 90.73 | 2.63 | 92.42 | 2.17 | 91.38 | 2.04 | 0.572 |
Table 4: Anterior ratio and overall ratio of tooth size discrepancy of different malocclusion groups.
Discussion
The clinical importance of TSD in treatment planning has been the subject of various discussions in orthodontic literature. In our study, a comparison was made between TSD in different malocclusion groups. This is one of the few studies to be conducted in Sudan in which TSD have been studied in different malocclusion groups.
Our sample was construed of 70% females and 30% males which may indicate that females seek orthodontic treatment more than males. From this sample 49% had class I malocclusion, 38% class II div1 and the remaining divided between class II div2 and class III as shown in Figure 4.
The mean overall ratio for the whole sample was 91.16% which is very close to Bolton’s proposed ideal ratio. However the anterior ratio for the whole sample was found to be 78.31%, which is higher than Bolton’s proposed ideal ratio, thus reflecting a tendency towards greater mesiodistal widths in the mandibular anterior segment in our population sample.
In class I and class III patients, the mean overall ratios calculated was 91.37% and 91.38% respectively, which is closely similar to Bolton’s ideal ratio and the mean anterior ratios calculated was 78.44% and 78.37% which is higher than Bolton’s ideal ratio (Table 5).
| Quadrants | Tooth No. | Class I | Class II/1 | Class II/2 | Class III | P-value | ||||
|---|---|---|---|---|---|---|---|---|---|---|
| Mean | SD | Mean | SD | Mean | SD | Mean | SD | |||
| Maxillary right | 11 | 9.03 | 0.72 | 9.18 | 0.59 | 8.83 | 0.76 | 9.18 | 0.78 | 0.619 |
| 12 | 7.08 | 0.62 | 7.49 | 0.59 | 7.75 | 0.66 | 7.68 | 0.64 | 0.002 | |
| 13 | 8.00 | 0.44 | 8.20 | 0.41 | 8.33 | 0.28 | 8.45 | 0.56 | 0.011 | |
| 14 | 7.36 | 0.63 | 7.54 | 0.51 | 7.33 | 0.57 | 7.59 | 0.43 | 0.369 | |
| 15 | 7.08 | 0.54 | 7.35 | 0.51 | 7.00 | 0.50 | 7.31 | 0.51 | 0.078 | |
| 16 | 10.78 | 0.59 | 10.81 | 0.53 | 11.00 | 0.00 | 10.09 | 3.07 | 0.241 | |
| Maxillary left | 21 | 8.89 | 0.72 | 9.10 | 0.59 | 8.83 | 0.76 | 9.22 | 0.71 | 0.301 |
| 22 | 7.10 | 0.59 | 7.32 | 0.69 | 7.25 | 1.14 | 7.45 | 0.56 | 0.297 | |
| 23 | 7.97 | 0.45 | 8.17 | 0.45 | 8.00 | 0.86 | 8.36 | 0.50 | 0.051 | |
| 24 | 7.43 | 0.62 | 7.60 | 0.50 | 7.66 | 0.57 | 7.45 | 0.78 | 0.841 | |
| 25 | 7.06 | 0.57 | 7.31 | 0.56 | 6.83 | 0.76 | 7.54 | 0.68 | 0.030 | |
| 26 | 10.74 | 0.65 | 10.89 | 0.59 | 11.00 | 0.50 | 11.04 | 0.72 | 0.429 | |
| Mandibular left | 31 | 5.62 | 0.51 | 5.70 | 0.48 | 5.66 | 0.57 | 5.95 | 0.65 | 0.300 |
| 32 | 6.24 | 0.44 | 6.30 | 0.47 | 6.50 | 0.50 | 6.40 | 0.49 | 0.578 | |
| 33 | 6.95 | 0.52 | 7.15 | 0.56 | 7.00 | 1.00 | 7.31 | 0.64 | 0.157 | |
| 34 | 7.48 | 0.64 | 7.56 | 0.53 | 7.75 | 0.66 | 7.45 | 0.56 | 0.789 | |
| 35 | 7.55 | 0.56 | 7.58 | 0.54 | 7.50 | 0.50 | 7.93 | 0.67 | 0.252 | |
| 36 | 11.22 | 0.80 | 11.39 | 0.65 | 11.41 | 0.52 | 11.56 | 0.86 | 0.482 | |
| Mandibular right | 41 | 5.63 | 0.53 | 5.80 | 0.43 | 5.66 | 0.57 | 6.13 | 0.50 | 0.021 |
| 42 | 6.20 | 0.51 | 6.23 | 0.44 | 6.16 | 0.28 | 6.40 | 0.49 | 0.648 | |
| 43 | 7.06 | 0.51 | 7.22 | 0.54 | 7.50 | 0.86 | 7.22 | 0.81 | 0.375 | |
| 44 | 7.38 | 0.59 | 7.59 | 0.54 | 8.16 | 1.04 | 7.59 | 0.49 | 0.070 | |
| 45 | 7.57 | 0.62 | 7.73 | 0.50 | 7.50 | 0.50 | 7.75 | 0.43 | 0.515 | |
| 46 | 11.07 | 0.82 | 11.43 | 0.58 | 11.41 | 0.14 | 11.59 | 0.83 | 0.051 | |
Table 5: Comparison of mesiodistal tooth width in the different malocclusion groups.
There was a significant difference from the ideal for Class II division 1 and Class II division 2 patients whose corresponding overall ratios were calculated at 90.73% and 92.42% respectively. Here, the relevant anterior ratios were 78.11% and 78.57% respectively; again, markedly greater than Bolton’s ideal ratio.
These indicate a tendency of maxillary tooth excess in Class II division 1 malocclusions. This is somewhat in accordance with Strujic et al. [18]; he found there was a tendency for mandibular tooth excess in subjects with Class III malocclusions and for maxillary tooth excess in subjects with Class II malocclusions in an orthodontic population.
The higher prevalence of anterior TSDs in this Sudanese orthodontic population suggests that a tooth size analysis should be conducted at the treatment planning stage. Where significant TSDs are detected, this is normally accommodated by the reduction or augmentation of tooth tissue [19].
We were unable to find any statistically significant differences in the mean overall and anterior tooth size ratios between the different malocclusion groups. This is in accordance to Uysal and Sari [17] who identified no differences in tooth size ratios between malocclusion groups in a Turkish population, also in accordance to O’Mahony and Millett [11] who identified no statistical difference in tooth size ratios between malocclusion groups in an Irish population, but contrasts with Nie and Lin [12] who identified a higher prevalence of increased overall tooth size ratios in Class III malocclusions compared to Class I and Class II malocclusions in a Chinese population.
In this study the mean anterior tooth size ratios exhibited no statistically significant differences between genders and among the malocclusion groups. This is similar in findings to Crosby and Alexander [16], and Araujo and Souki [9].
Also in this study a comparison was made between the left and right segments of both maxillary and mandibular arches. There was a significant difference found between left and right maxillary central and lateral incisors in the mesiodistal width, but no significant difference between the rests of the maxillary teeth.
In the mandibular arch a significant difference was found in the mesiodistal width between the left and right central incisors and canines.
Conclusion
• Class I, class II, and class III patients showed mean anterior tooth size ratio slightly higher than Bolton’s anterior ratio.
• Class II division 1 patients showed mean overall ratio slightly lower to Bolton’s overall ratio and Class division 2 patients showed mean overall ratio slightly higher than Bolton’s overall ratio.
• There were no statistically significant differences of overall and anterior TSD with regard to gender or malocclusion.
• The results help in treatment planning, putting in consideration tooth size discrepancy and decision for extraction.
Recommendation
Although Mageet Orthodontic Training Centre caters for all personnel belonging to various regions of the country, a larger study at the national level is required to verify the applicability of these results to our population and also to compare between tooth size and arch length.
References
- https://www.elsevier.com/books/mosbys-medical-dictionary/mosby/978-0-323-08541-0
- Fields HW (1981) Orthodontic-restorative treatment for relative mandibular excess tooth-size problems. Am J Orthod 79: 176-183.
- Proffit WR (2013) Contemporary orthodontics (5th edn.). St. Louis, Mosby, Missouri pp: 181-183.
- Black GV (1902) Descriptive analysis of the human teeth (4th edn.). SS White, Philadelphia, PA, USA.
- Ballard ML (1944) Asymmetry in tooth size: a factor in the etiology, diagnosis and treatment of malocclusion. Angle Orthod 14: 67-71.
- Bolton WA (1958) Disharmony in tooth size and its relation to the analysis and treatment of malocclusion. Angle Orthod 28: 113-130.
- Bolton WA (1962) The clinical application of tooth-size analysis. Am J Orthod 48: 504-529.
- Akyalcin S, Dogan S, Dincer B, Erdinc AM, Oncag G (2006) Bolton tooth size discrepancies in skeletal class I individuals presenting with different dental angle classifications. Angle Orthod 76: 637-643.
- Araujo E, Souki M (2003) Bolton anterior tooth size discrepancies among different malocclusion groups. Angle Orthod 73: 307-313.
- Al-Tamimi T, Hashim HA (2005) Bolton tooth-size ratio revisited. World J Orthod 6: 289-295.
- O’Mahony G, Millett DT, Barry MK, McIntyre GT, Cronin MS (2011) Tooth size discrepancies in irish orthodontic patients among different malocclusion groups. Angle Orthod 81: 130-133.
- Nie Q, Lin J (1999) Comparison of intermaxillary tooth size discrepancies among different malocclusion groups. Am J Orthod Dentofac Orthop 116: 539-544.
- Johe RS, Steinhart T, Sado N, Greenberg B, Jing S (2010) Intermaxillary toot size discrepancies in different sexes, malocclusion groups and ethnicities. Am J Orthod Dentofac Orthop 138: 599-607.
- Smith SS, Buschang PH, Watanabe E (2000) Interarch Tooth Size Relationships of Three Populations: Does Bolton Analysis Apply? Am J Orthod Dentofac Orthop 117: 169-174.
- Lavelle CL (1972) Maxillary & mandibular tooth size in different racial groups and in different occlusal categories. Am J Orthod 61: 29-37.
- Crosby DR, Alexander CG (1989) The occurrence of tooth size discrepancies among different malocclusion groups. Am J Orthod Dentofac Orthop 95: 457-461.
- Uysal T, Sari Z (2005) Intermaxillary tooth size discrepancy and mesiodistal crown dimensions for a Turkish population. Am J Orthod Dentofac Orthop 128: 226-230.
- Strujic M, Anic-Milosevic S, Mestrovic S, Slaj M (2009) Tooth size discrepancy in orthodontic patients among different malocclusion groups. Eur J Orthod 31: 584-589.
- Tong H, Chen D, Xu L, Liu P (2004) The effect of premolar extractions on tooth size discrepancies. Angle Orthod 74: 508-511.
Open Access Journals
- Aquaculture & Veterinary Science
- Chemistry & Chemical Sciences
- Clinical Sciences
- Engineering
- General Science
- Genetics & Molecular Biology
- Health Care & Nursing
- Immunology & Microbiology
- Materials Science
- Mathematics & Physics
- Medical Sciences
- Neurology & Psychiatry
- Oncology & Cancer Science
- Pharmaceutical Sciences
